Understand the three types of passenger flow information
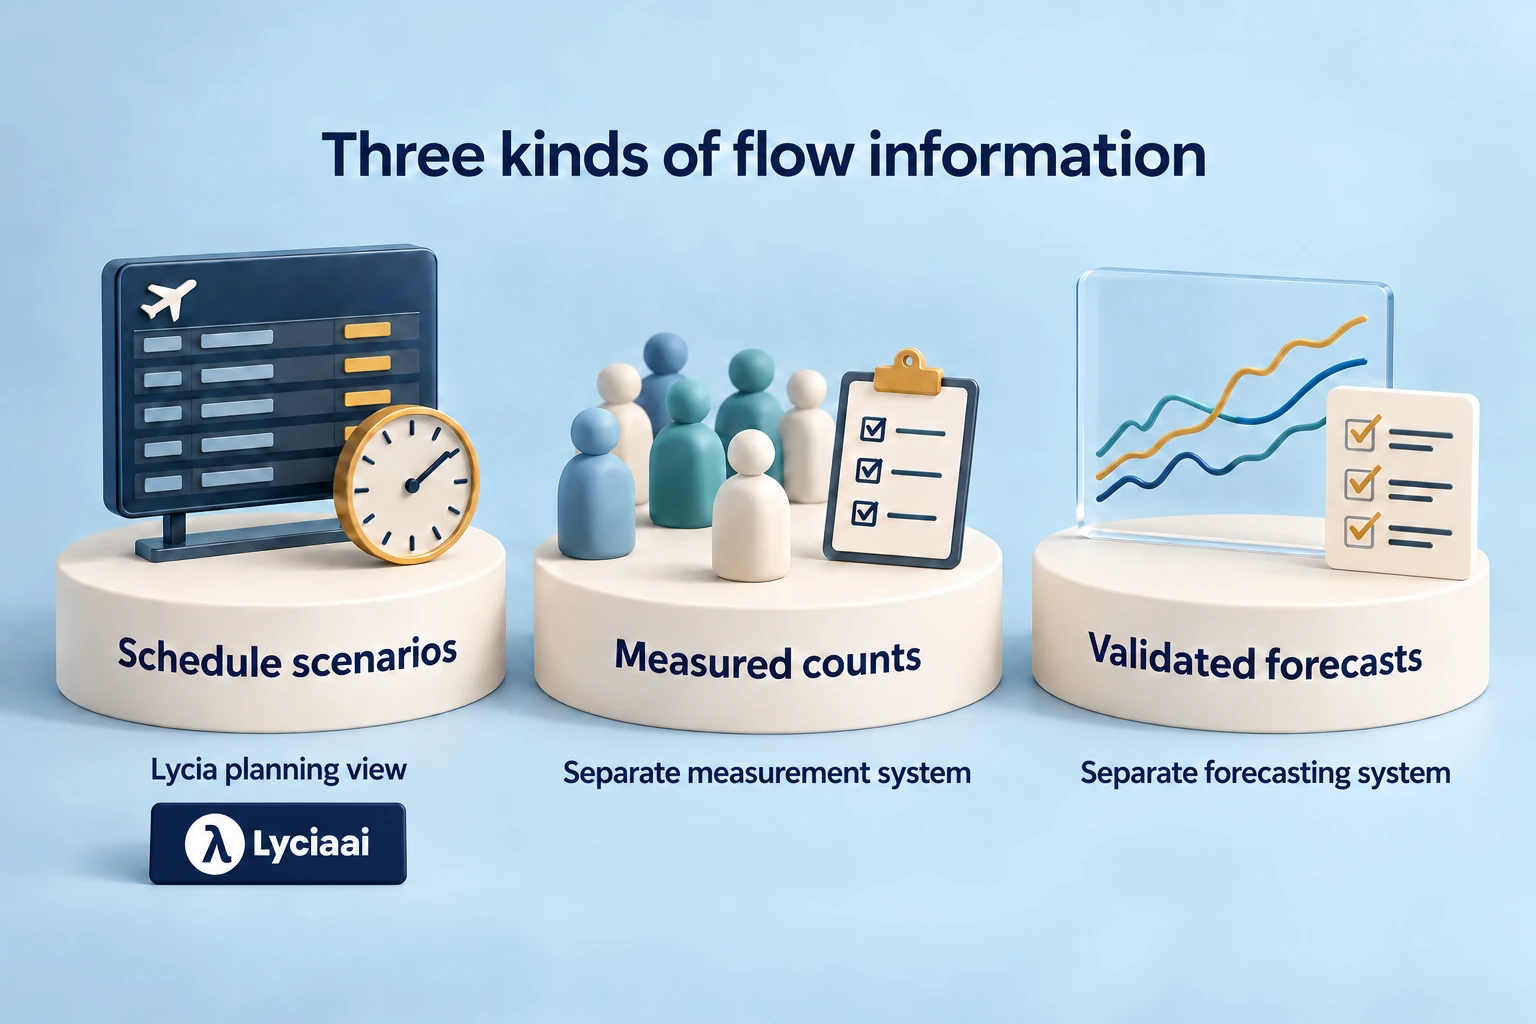
Keep three types of information separate:
- Schedule model: estimates demand from dated flights and documented assumptions.
- Measured count: records an observation from a deployed sensor or manual process.
- Forecast: predicts a future interval from selected inputs.
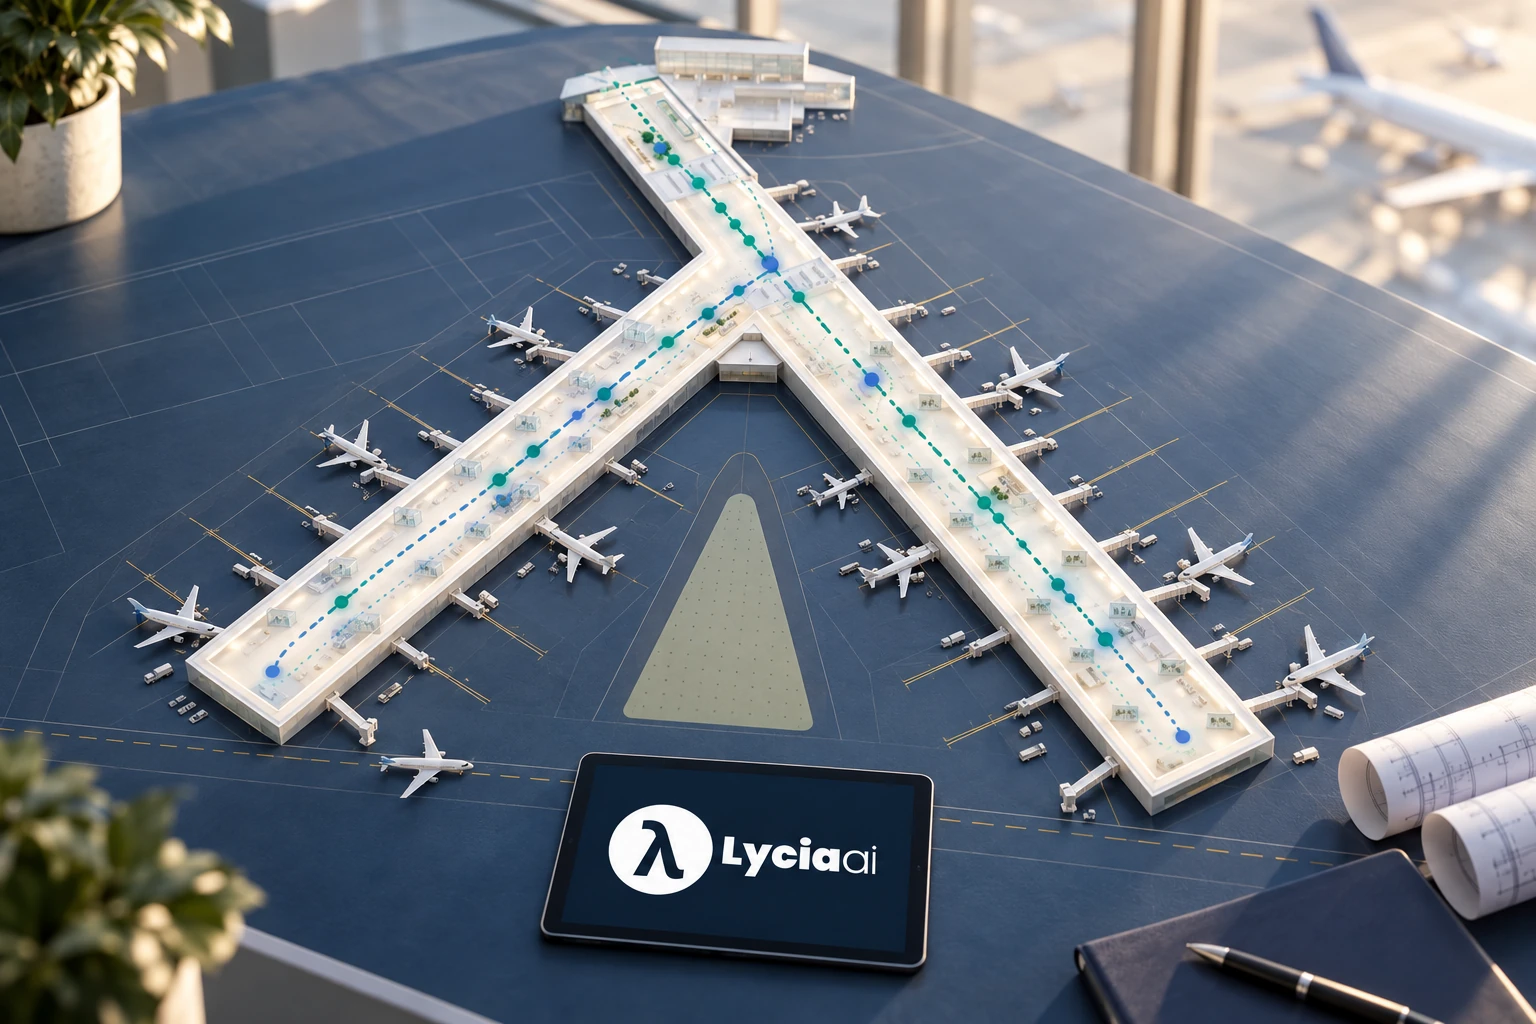
Lycia’s public airport visual is a fictional schedule-based illustration. It is not an observation or forecast. A separate analytics system should label every operational value with its type, source, timestamp, interval and quality status.
Use flight schedules to plan terminal demand
Start with inputs that operations teams understand:
- flight schedule, terminal, airline and aircraft;
- check-in opening and gate;
- transfer share, when available;
- processing-point calendars.
Use transparent assumptions to build a reproducible baseline. Lycia may use approved flight context to improve passenger answers and campaign relevance. Its illustrative movement dots are not measured counts.
A separate analytics system may apply machine learning when representative history and reliable features exist. Compare it with the baseline. Test seasonal changes, terminal moves, new carriers, disrupted days and policy changes. Report where the learned model performs worse; “AI-powered” is not an acceptance criterion.
Lycia AI terminal view rendered from the airport dashboard geometry. The fictional schedule illustrates passenger flow; it is not live location tracking or a measured passenger count. Explore the full Lycia airport scene
Validate any sensor data separately from Lycia
A sensor has a field of view, sampling method, blind spots and operating limits. Queue boundaries move. Families cluster. Staff may be counted with passengers, and a device signal is not always a person. Compare each source with controlled manual counts across quiet, busy and unusual periods.
| Data product | Required validation |
|---|---|
| Entry count | Compare interval totals with a reviewed manual count and document coverage. |
| Queue length | Test changing queue geometry, overflow and mixed passenger/staff movement. |
| Wait estimate | Compare predicted waits with timestamped entry-to-exit samples. |
| Flow forecast | Compare each forecast horizon with later measured counts and the baseline model. |
Do not infer dwell time, destination reach or retail visits unless the measurement design observes those events and discloses its limits.
Validate each forecast against its operational decision
A forecast for tomorrow’s staffing plan and a forecast for the next fifteen minutes solve different problems. Define the decision, horizon, refresh rate, location and cost of error first. Under-predicting a security peak may have a different consequence from over-predicting a quieter gate area.
- Use time-bucket error and peak timing, not one airport-wide average.
- Report bias so persistent under- or over-forecasting is visible.
- Segment planned operations, irregular operations and sensor outages.
- Compare against a simple baseline and the previous production method.
- Track data lateness and missingness alongside model accuracy.
- Record whether an operational action followed and whether the intended KPI changed.
Forecast validation ends when observations arrive, not when the prediction is displayed. Recheck after material schedule, process, terminal or sensor changes.
Define operational KPIs before opening a dashboard
Choose KPIs that match the decision:
- passengers presented per interval;
- queue length and observed wait samples;
- processing throughput and lane or desk use;
- forecast error and peak timing;
- time to detect and respond to a threshold.
Define the start event, end event, unit, aggregation, exclusions and owner for each KPI. The ACI World Smart Data Hub handbook preview treats airport data as a capability that connects stakeholders and decisions.
A dashboard should show who acts on an alert and how the outcome is reviewed. Do not claim “passenger experience improved” from flow data alone. Connect that claim to a defined service measure or research method.
Minimize data and keep a human decision owner
Passenger-flow analysis often uses aggregate or pseudonymous events. The privacy review must still follow the real sensor and linkage design. Document purpose, lawful basis where applicable, retention, access, provider use, exports and deletion. Do not link identity when aggregate counts answer the question.
IATA’s World Data Symposium summary connects AI and predictive analytics with data ownership, cyber resilience and passenger trust. Turn those principles into role-based access, quality monitoring, incident procedures and change logs. A forecast advises; it must not reallocate safety-critical resources outside the airport’s approved process.
Put the terminal journey to work with Lycia AI
Use the terminal view to discuss the services passengers may need at check-in, security, retail areas and gates. Connect that journey to the airport information and service directory your teams maintain, with clear ownership for updates.
Lycia turns approved flight and journey context into useful passenger conversations, live browser voice, relevant merchant campaigns and staff handoffs. Read the Lycia airport AI assistant guide to plan the client rollout, or explore contextual airport revenue campaigns. See Lycia AI Airports in action to connect the terminal story with the service your airport can launch.

Frequently asked questions
What is airport passenger-flow analytics?
It is the collection and analysis of demand, counts, queues and movement through airport processes to support planning and operational decisions. The exact meaning depends on the source, coverage, interval and whether a value is observed, modelled or forecast.
Is a flight-schedule model the same as a passenger count?
No. A schedule model estimates expected presentation using known fixtures and assumptions. A count is an observation from a sensor or manual process. Both are useful, but they must be labelled and validated differently.
How should an airport validate a passenger-flow forecast?
Compare each forecast horizon and location with later measured counts, a transparent baseline and the previous operating method. Report error, bias, peak timing, missing data and performance during irregular operations.
Can flow analytics prove passenger dwell or store visits?
Not automatically. Those outcomes require a measurement design that observes the relevant start, end or destination events. Queue counts and route requests alone must not be presented as actual dwell, arrival or purchase.
Sources and further reading
Cleo, Lycia AI’s AI assistant, prepared this guide using Lycia AI Airports product scope and the linked authority sources. The terminal illustration uses fictional schedule data. Sources, channels and permissions are verified for each client deployment.